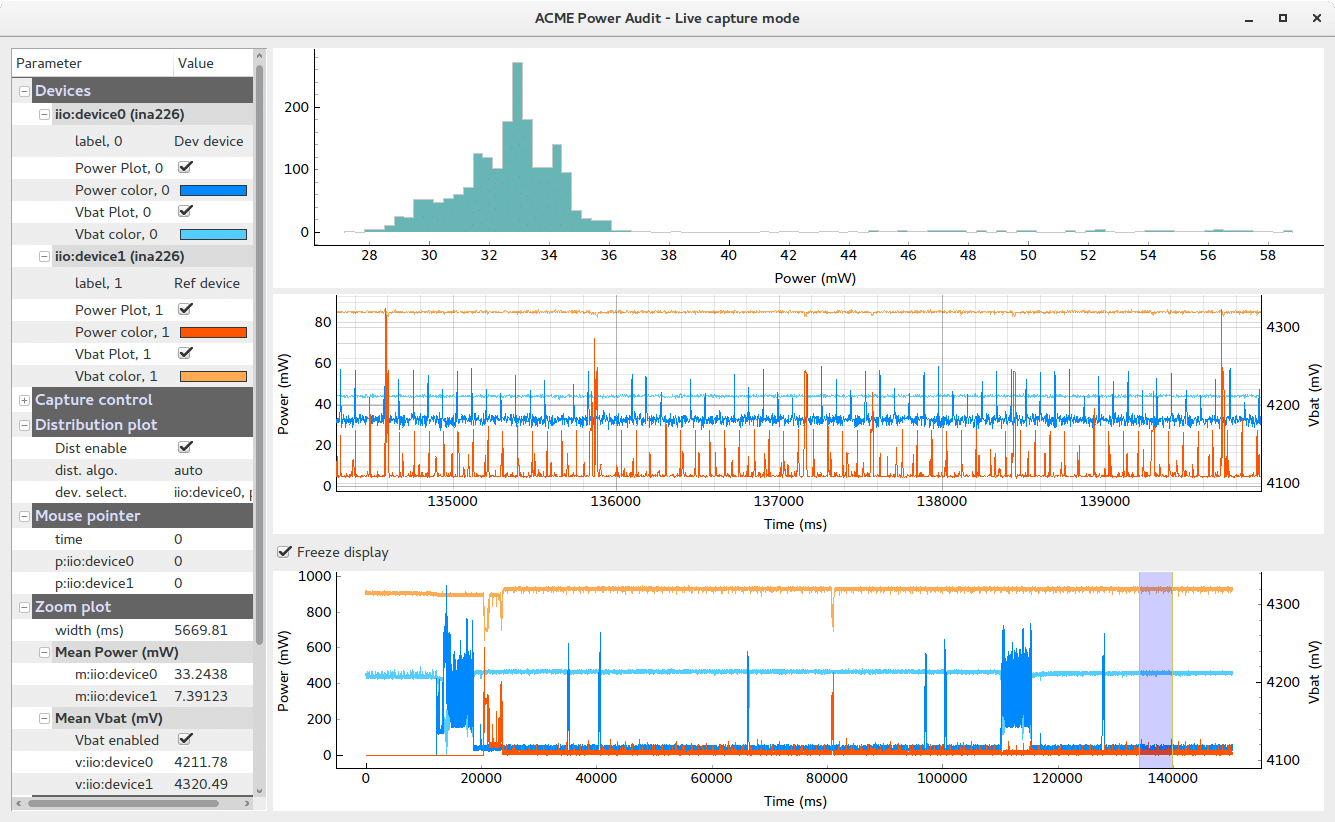
A couple of weeks ago, we made public the ‘pyacmegraph’ tool that might interest you if you use our ACME probes for power management study or debug.
This tool handles ACME probes data capture and display, with some fancy features added.
Simply put, it’s an easy to use tool that aims at getting the best of ACME for studying a device power consumption.
In this post I will introduce pyacmegraph and explain how ACME is used to measure power and send this information to pyacmegraph. In a subsequent post, I will detail pyacmegraph features and functionning.
Here is a capture of pyacmegraph in action:
Features
Here is a non-exhaustive feature list:
- auto-detect connected ACME probes and their Rshunt, setup the probes and capture data from probes
- compute and display Power consumption and Vbat with multiple zoom capabilities
- real-time statistics: mean Power, mean Vbat, distribution graph on a selected channel
- support any number of probes on an ACME cape
- save captured data for later offline visualization with pyacmegraph (view mode)
- save data as text or image
- re-use a saved data file UI settings for a fresh run (like device names, enabled plots, colors, Rshunts, …)
- can display Ishunt instead of power
- can force the use of a fixed Vbat value instead of the Vbat data captured from ACME probe
- control ACME probes power switch
The tool is written in Python and tested on Python 2.7. It requires libiio and its python bindings, plus a couple of python extensions (numpy, pyqtgraph, pyqt4). Refer to our github pyacmegraph page for detailed installation instructions.
For using this tool with ACME, you will need an IIO enabled ACME SW release, as found here:
– pre-built image with IIO: https://github.com/baylibre-acme/ACME/releases
or
– building the SW with IIO: https://github.com/baylibre-acme/ACME
How do we get a power value out of ACME?
Before going further, let’s take a closer look at what we measure with ACME, why we do it and how.
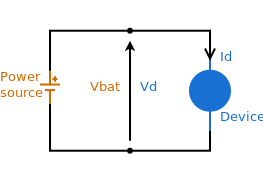
Here is a simple représentation of a device we want to study, connected to its power source (battery, power supply, …):
Power basics
First the basics: get back to our old electronics course with the Ohm law:

V is the Voltage, measured in Volts (V)
I is the current or amperage, measured in Amps (or Amperes) (A)
R is the resistance measured in Ohms
P is the power measured in Watts
Usually we just have access to the couple of wires powering the device we want to study. According to above formulas, for computing the power dissipated into the device we need a way to measure both Vd (voltage drop on the device) and Id (current flowing through the device). Considering that we want a relatively simple and cheap measuring tool (but that we still want reliable and precise measurements), and that it’s relatively easy to measure a voltage drop – we use an ADC – (so Vd shall be easy), how can we measure Id?
Well, I have to admit we usually rely on a small trick, that is to add a component to help us: a resistor with a really small and precise value, a shunt resistor.
Here is an electrical diagram showing a shunt resistor in action:
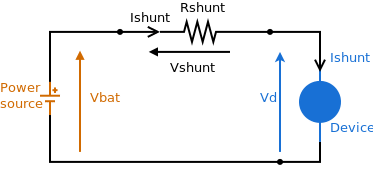
(note that the same current flows through this simple circuit, here labeled ‘Ishunt’ and going through the shunt resistor and the device under test)
So we insert a shunt resistor in series with the device to measure. This small resistor will induce a small voltage drop (one reason for using a small resistor value: the drop shall be small enough to not disturb the device). Typical shunt resistors that we use with the ACME probes are in the 5 mOhms to 500 mOhms range.
Why don’t we always choose a very small shunt resistor? It depends on the current range we want to measure here: our measuring tool is able to measure a voltage drop within a fixed range. We need to size the shunt resistor so that the current variations flowing through our shunt induce a voltage drop fitting with our measuring tool range: too high voltage and we saturate our ADC and report truncated values; too low and we have a poor resolution as we use a small range of our ADC. See the ACME page for details on ADC characteristics and current measuring ranges with the various proposed shunt resistors.
ACME and pyacmegraph in action
The principle used in ACME is first to measure this small voltage drop (Vshunt) into the shunt resistor using a precise ADC. Then, as we know the shunt resistor (Rshunt), we can deduct the current flowing into this wire:

Then we know that the same current (Ishunt) also flows through the Device we are measuring. So if we can measure the voltage drop of the Device (Vd on the above schematic), we shall be able to deduce the power consumed in the device:

So this is roughly what the ACME probe will achieve: introduce a precise and small value shunt resistor in series with the device to measure and measure the voltage drops at the the shunt resistor level and at the device level.
Here is an illustration of it achieved using an ACME HE10 power probe (the power probe embeds the shunt resistor, and the Vbat negative pole is connected with the brown wire on the schematic) . The principle is the same for the other ACME probe types:
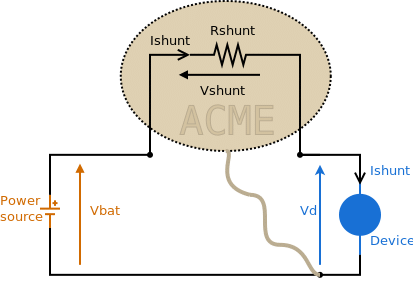
ACME captures these voltages, and exposes them through the IIO framework. Finally on the host, through libiio, pyacmegraph captures Vshunt and Vd, and considering Rshunt value, makes the maths to provide a Power value. This is achieved several times per second (can be up to 1kHz depending on the number of probes plugged-in).
Note that Vd is called ‘Vbat’ in pyacmegraph (but it corresponds to the voltage at the device poles, excluding the shunt).
That’s all for the basics. In the next post I’ll present pyacmegraph features in detail and show you how it can tremendously help in measuring and analyzing your device power consumption. Stay tuned!
The ACME power measurement and remote access tool is developed by BayLibre. More info can be found on the product page. It is available for purchase online.
Save


